Dynamsoft Developer Blog
Featured Content
View More >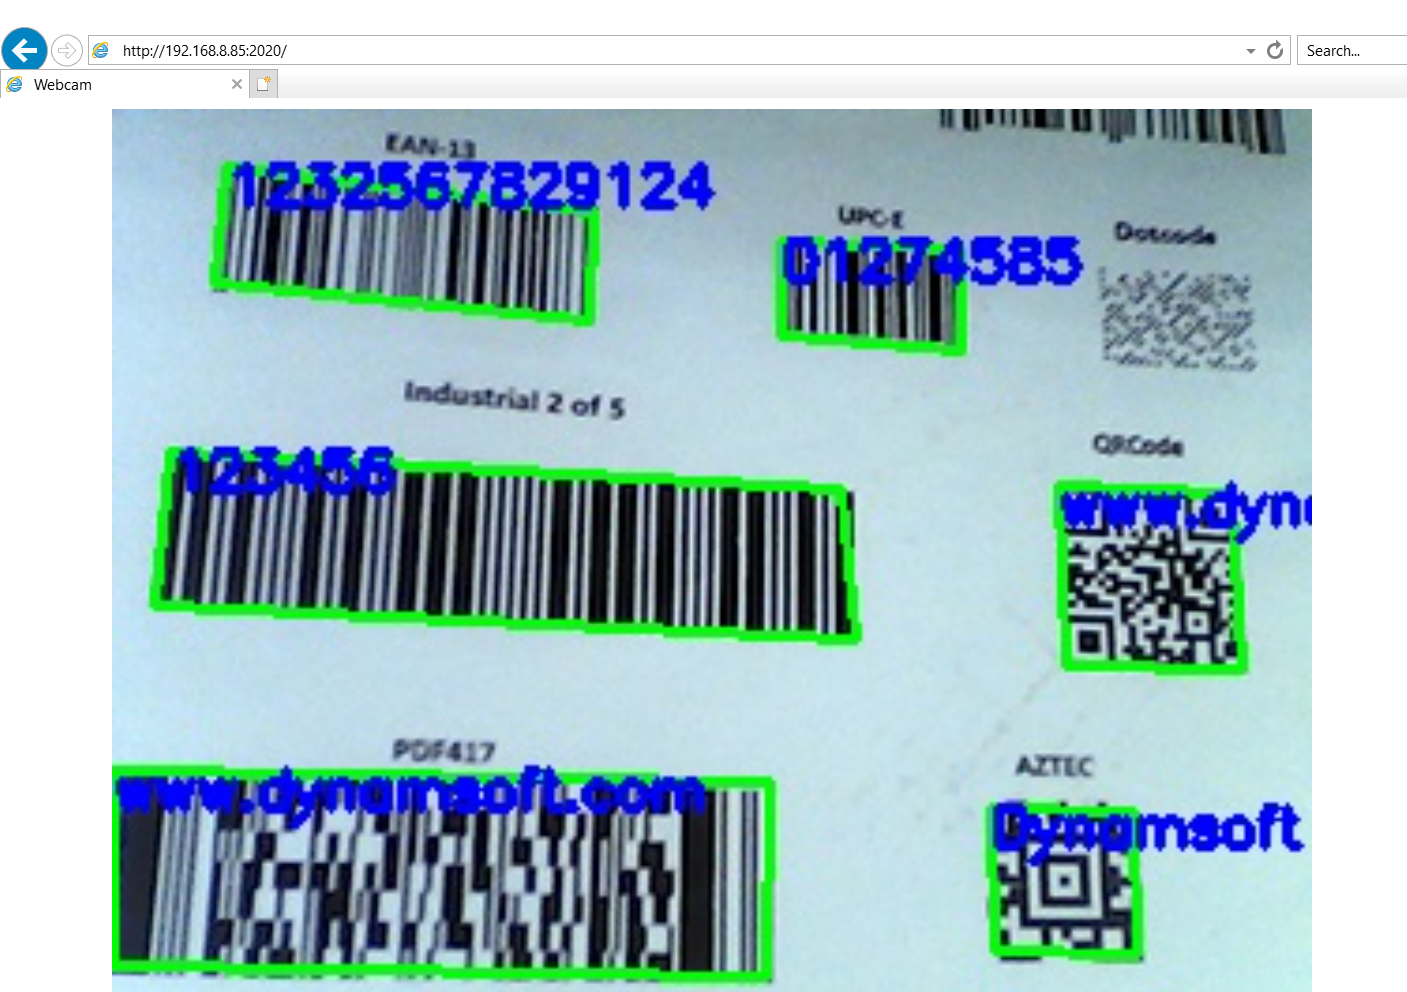
Node.js Barcode and QR Code Reader for Desktop and Web
How to Build .NET 6 Barcode and QR Code SDK for Windows, Linux & macOS
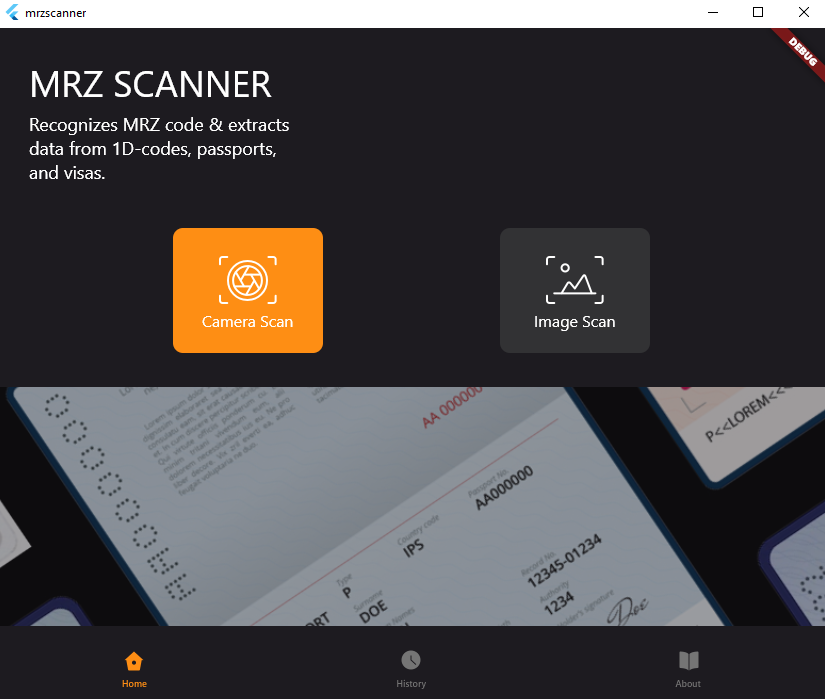
How to Create a Cross-platform MRZ Scanner App Using Flutter and Dynamsoft Label Recognizer
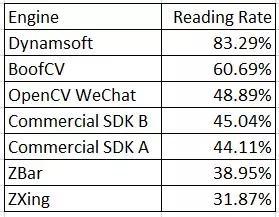
QR Code Reading Benchmark and Comparison
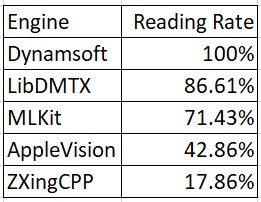
What are the Best Data Matrix Reading SDKs?
-
An identity document or ID card is any document that may be used to prove a person’s identity. There are various forms of identity documents: driver’s license, passport and formal identity card. Barcodes and MRZ (machine-readable zones) are often printed on an ID card so that its info can be...
-
If you want to use the PHP Laravel framework to build a web-based barcode and QR code reader, you can implement the barcode detection logic on either the client side or the server side. Dynamsoft offers a variety of SDKs for different platforms, including desktop, mobile, and web. In this...
-
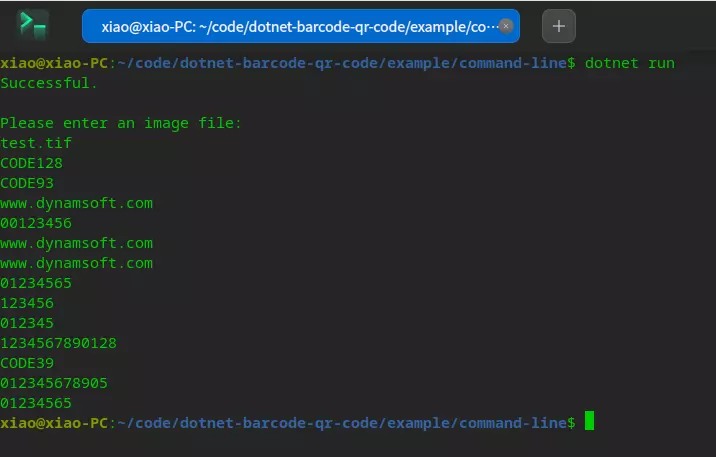
When using PHP, you may sometimes need to integrate a few C++ libraries. This article guides you through the process of building a PHP Barcode and QR Code reading extension using the Dynamsoft C++ Barcode SDK on both Windows and Linux. This article is Part 1 in a 2-Part Series....
-
Shadow DOM is a web standard designed to encapsulate HTML and CSS into web components. It allows for the creation of separate DOM trees and specifies how these trees interact with each other in a document. Polymer is a library developed by Google to make it easier to create reusable...
-
Laravel is a PHP Framework. This article shares how to use Dynamic Web TWAIN to scan and upload documents in a Laravel project, enhancing web document management capabilities. This article is Part 5 in a 5-Part Series. Part 1 - Building Web Document Scanning Applications with ASP.NET Core MVC Part...
-
An identity document or ID card is any document that may be used to prove a person’s identity. There are various forms of identity documents: driver’s license, passport and formal identity card. Barcodes and MRZ (machine-readable zones) are often printed on an ID card so that its info can be...
-
Django is a popular Python framework for web development. In this tutorial, we will create a web application using Django and Dynamic Web TWAIN. This article is Part 4 in a 5-Part Series. Part 1 - Building Web Document Scanning Applications with ASP.NET Core MVC Part 2 - How to...
-
In a previous article, we developed a barcode and QR code scanner for Windows and Android using Qt6. In this follow-up, we’ll extend the project to include support for iOS devices. To achieve this, we’ll integrate the Dynamsoft iOS Barcode Reader SDK. To facilitate seamless communication between the SDK and...
-
Qt is renowned for its cross-platform capabilities, enabling developers to craft applications for Windows, macOS, Linux, iOS, and Android. In this article, we will construct a QR code scanner for Windows and Android utilizing Qt6. The sample code will be presented in C++ and QML, employing the Dynamsoft Barcode Reader...
-
Object detection is a computer technology related to computer vision and image processing that deals with detecting instances of semantic objects of a certain class (such as humans, buildings, or cars) in digital images and videos.1 It can be used in a barcode reading task as barcodes are often printed...