How to Scan Barcodes in Jupyter Notebook
Jupyter notebook is a web-based interactive computing environment that enables you to create and share documents that contain live code, equations, visualizations and narrative text. If you have installed Anaconda, Jupyter notebook is installed by default. This article demonstrates how to write Python code to scan barcodes in Jupyter notebook.
Pre-requisites
- Apply for a trial license of Dynamsoft Barcode Reader SDK.
Creating a Jupyter Notebook for Python Barcode Scanning
-
Run Jupyter notebook:

-
Open
http://localhost:8888/in your browser to create abarcode_scanning.ipynbfile.
-
Insert a new cell to install Dynamsoft Barcode Reader, OpenCV, and Matplotlib:
%pip install dynamsoft-barcode-reader-bundle opencv-python matplotlib -
Initialize the license of barcode SDK and barcode reader object:
from dynamsoft_capture_vision_bundle import * license_key = "LICENSE-KEY" error_code, error_message = LicenseManager.init_license(license_key) cvr_instance = CaptureVisionRouter() -
Create an image upload button in Jupyter notebook:
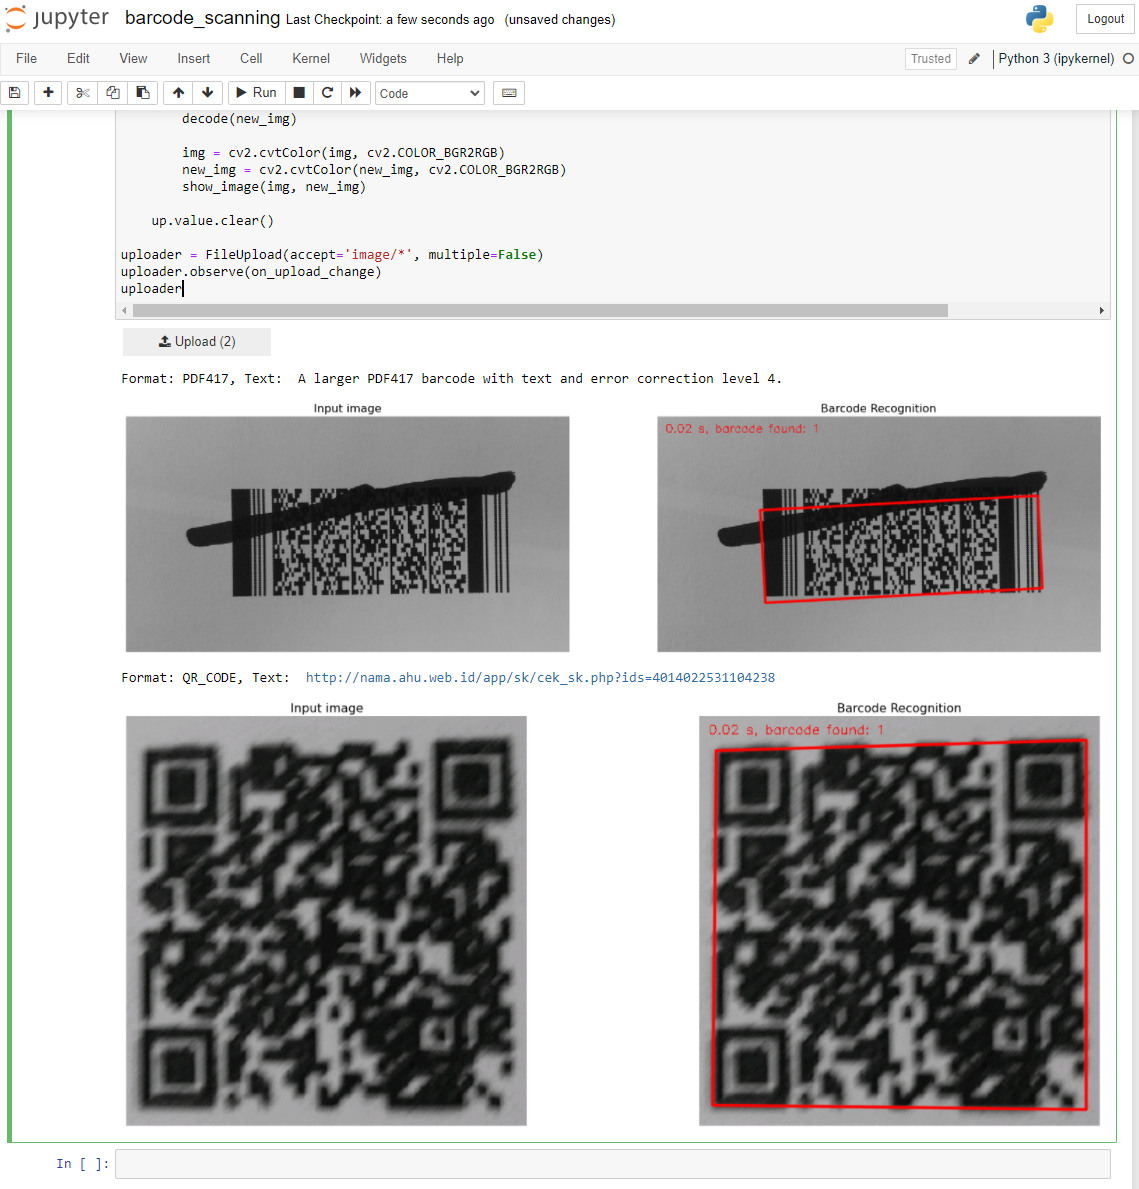
from ipywidgets import FileUpload def on_upload_change(change): if change.name != "value": return if not change.new: return up = change.owner files_obj = change.new records = list(_flatten_records(files_obj)) for rec in records: try: content = _get_bytes(rec) except Exception as e: print("Skip unsupported record:", e) continue buf = np.frombuffer(content, dtype=np.uint8) img = cv.imdecode(buf, cv.IMREAD_COLOR) if img is None: print("Failed to decode image.") continue new_img = img.copy() try: decode(new_img) except Exception as e: print("Decode error:", e) img_rgb = cv.cvtColor(img, cv.COLOR_BGR2RGB) new_rgb = cv.cvtColor(new_img, cv.COLOR_BGR2RGB) show_image(img_rgb, new_rgb) try: up.unobserve(on_upload_change, names="value") except Exception: pass reset_done = False for val in ((), [], None): try: up.value = val reset_done = True break except Exception: continue if not reset_done: try: up.value.clear() reset_done = True except Exception: pass try: up.observe(on_upload_change, names="value") except Exception: pass uploader = FileUpload(accept='image/*', multiple=True) uploader.observe(on_upload_change, names="value") uploader -
Convert the image data to numpy array and then decode the image with OpenCV API:
import cv2 as cv import numpy as np for rec in records: try: content = _get_bytes(rec) except Exception as e: print("Skip unsupported record:", e) continue buf = np.frombuffer(content, dtype=np.uint8) img = cv.imdecode(buf, cv.IMREAD_COLOR) -
Scan barcodes with Dynamsoft Barcode Reader API:
def decode(frame): before = time.time() result = cvr_instance.capture(frame, EnumPresetTemplate.PT_READ_BARCODES.value) after = time.time() COLOR_RED = (0, 0, 255) thickness = 2 text_x, text_y = 10, 20 if result.get_error_code() != EnumErrorCode.EC_OK: print("Error:", result.get_error_code(), result.get_error_string()) cv.putText(frame, f'{after - before:.2f} s, barcode found: 0', (text_x, text_y), cv.FONT_HERSHEY_SIMPLEX, 0.5, COLOR_RED) return items = result.get_items() found = len(items) for item in items: format_type = item.get_format() text = item.get_text() print(f'Format: {format_type}, Text: {text}') loc = item.get_location() pts = np.array([[p.x, p.y] for p in loc.points], dtype=np.int32) cv.drawContours(image=frame, contours=[pts], contourIdx=-1, color=COLOR_RED, thickness=thickness, lineType=cv.LINE_AA) cv.putText(frame, f'{format_type}', (pts[0][0], pts[0][1] - 10), cv.FONT_HERSHEY_SIMPLEX, 0.5, COLOR_RED) cv.putText(frame, f'{text}', (pts[0][0], pts[0][1] - 30), cv.FONT_HERSHEY_SIMPLEX, 0.5, COLOR_RED) cv.putText(frame, f'{after - before:.2f} s, barcode found: {found}', (text_x, text_y), cv.FONT_HERSHEY_SIMPLEX, 0.5, COLOR_RED) new_img = img.copy() decode(new_img) -
Display the barcode recognition results with Matplotlib:
 import matplotlib.pyplot as plt

 def show_image(img1, img2):
     fig = plt.figure(figsize=(18, 8))
     ax1 = fig.add_subplot(1, 2, 1)
     ax1.set_title('Input image', fontsize=14)
     ax1.axis('off')
     ax2 = fig.add_subplot(1, 2, 2)
     ax2.set_title('Barcode Recognition', fontsize=14)
     ax2.axis('off')
     ax1.imshow(img1)
     ax2.imshow(img2)
     plt.show()
Source Code
https://github.com/yushulx/python-barcode-qrcode-sdk/tree/main/examples/official/jupyter_notebook


