


QR Code Reading Benchmark: Open-Source vs Commercial SDK Comparison — 7 Libraries Tested on 536 Real-World Images
QR codes are a critical part of modern applications — from payment systems and ticketing to inventory management and document tracking. As a two-dimensional barcode, a QR code can store significantly more data than a 1D barcode and is decoded from a camera image using image processing algorithms.
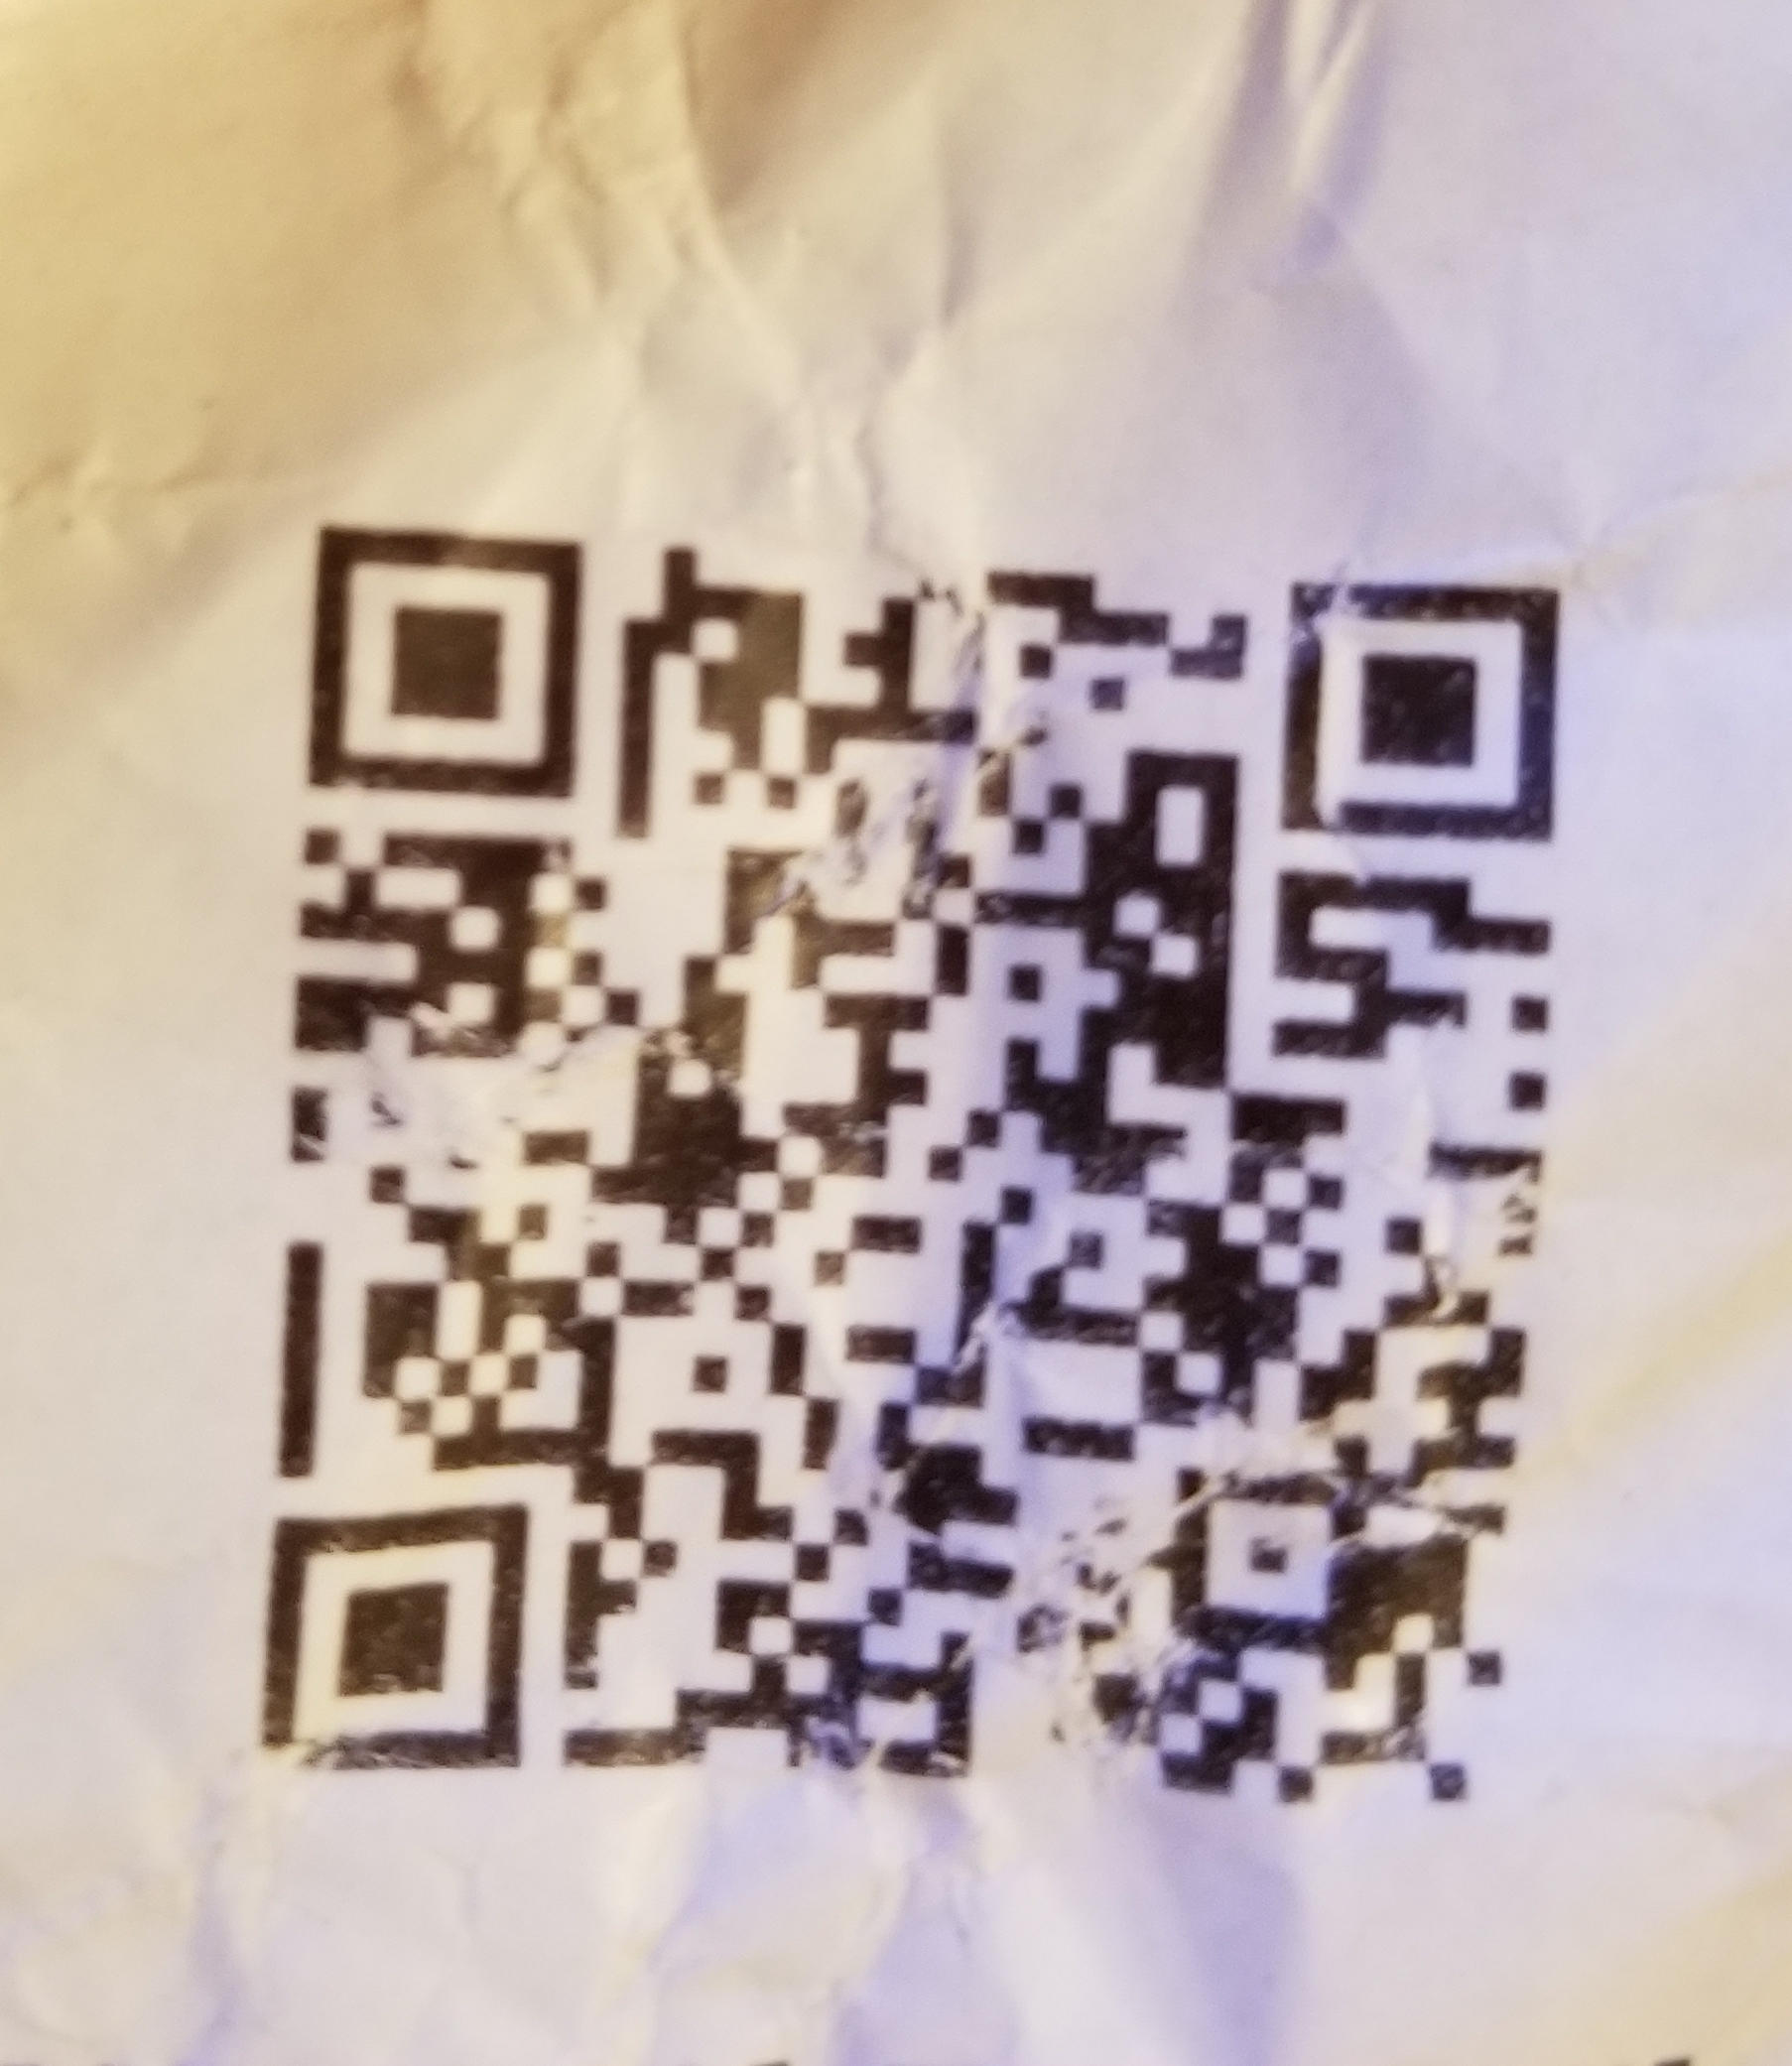
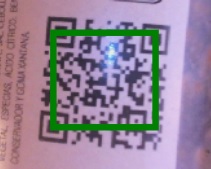
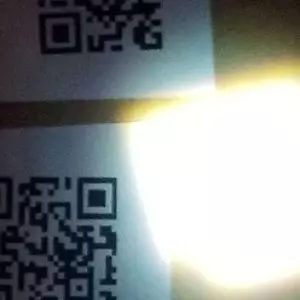
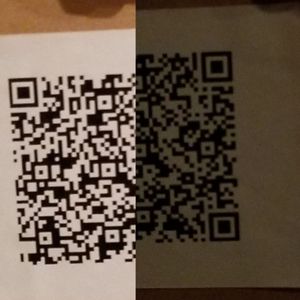
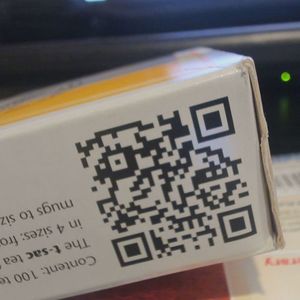
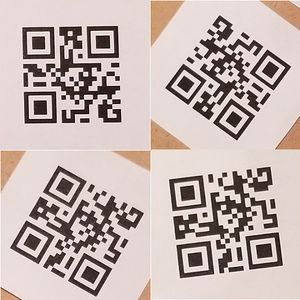
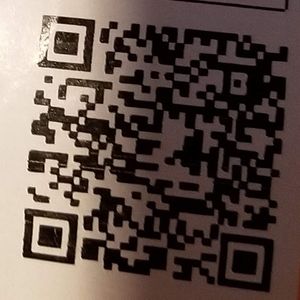
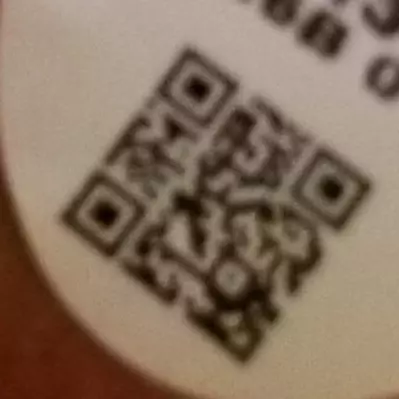
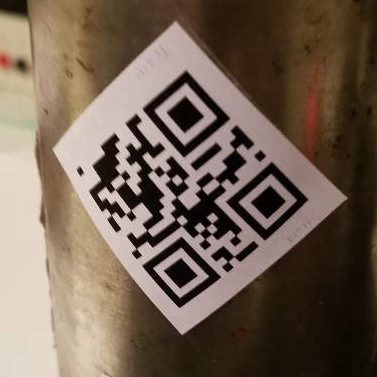
Choosing the right QR code reading library matters. Real-world QR codes are often blurred, damaged, curved, or printed with non-standard designs, and not every SDK handles these conditions equally well.
Independent benchmarks for QR code reading libraries are rare. One notable benchmark was produced by the author of the open-source BoofCV computer vision library, who assembled a labeled dataset of QR code images across 16 difficulty categories and tested five open-source libraries against it.
This article extends that benchmark to include commercial SDKs. We test 7 libraries and SDKs — both open-source and commercial — against the same dataset of 536 images containing 1,232 QR codes across 16 categories: blurred, bright_spots, brightness, close, curved, damaged, glare, high_version, lots, monitor, nominal, noncompliant, pathological, perspective, rotations, and shadows.
What you’ll build: A data-driven comparison of 7 QR code reading libraries tested against 536 real-world images, giving you the evidence to choose the right SDK for your production use case.
Key Takeaways
- Dynamsoft Barcode Reader achieves the highest overall reading rate of 83.29% across 16 challenging QR code categories — more than 20 percentage points ahead of the next commercial option.
- Among open-source libraries, BoofCV (60.69%) and OpenCV WeChat (48.89%) significantly outperform ZXing (31.87%) and ZBar (38.95%).
- ZXing and ZBar are only viable for controlled environments where image quality is consistently high.
- Speed and accuracy are not mutually exclusive: Dynamsoft decodes at 195 ms/image while leading in accuracy across 14 of 16 categories.
Common Developer Questions
How do I choose the most accurate QR code reading library for production use?
On this dataset, Dynamsoft Barcode Reader is the strongest production choice because it achieved 83.29% overall across 16 real-world categories while maintaining a 195 ms/image decode time. It also led 14 of the 16 categories, which matters more than a one-off win on a single image type.
Does ZXing work well for blurred or damaged QR codes?
Not in this benchmark. ZXing reached 31.87% overall and trailed badly on challenging categories such as blurred and damaged QR codes, so it is only reasonable for controlled, clean-image environments.
Which open-source QR code library gives the best balance of accuracy and speed on real-world images?
BoofCV is the strongest general-purpose open-source option in this comparison. It reached 60.69% overall at 104.95 ms per image, while OpenCV WeChat was more specialized for damaged and non-compliant codes but much slower at 757.71 ms per image.
What is the best Python QR code reader for real-world performance?
Among the Python-compatible options tested, Dynamsoft Barcode Reader delivered the best overall result at 83.29% and 195 ms per image. If you need an open-source Python path, ZBar via pyzbar and OpenCV WeChat are common choices, but both trail the top commercial result on this dataset.
This article is Part 1 in a 3-Part Series.
- Part 1 - QR Code Reading Benchmark: Open-Source vs Commercial SDK Comparison — 7 Libraries Tested on 536 Real-World Images
- Part 2 - 1D Barcode Scanner Accuracy Benchmark: Dynamsoft vs. ZXing, ZBar, and Scandit on 3 Public Datasets
- Part 3 - PDF417 Barcode Scanner SDK Benchmark: Accuracy and Speed Compared
Video:
Note: The article has been updated on 06/26/2023. The results in the video may have some slight differences.
Set Up the Benchmark Test Tool
All benchmarks were run using an open-source test harness. The source code is available at github.com/tony-xlh/barcode-reading-benchmark.
Test hardware: Intel i5-10400 CPU, 16 GB RAM.
Get a 30-day free trial license to run this benchmark against your own QR code images with Dynamsoft Barcode Reader.
Libraries and SDKs Evaluated
The following 7 QR code reading libraries and SDKs were evaluated:
- Dynamsoft Barcode Reader (version: 11.4.1000, commercial)
- Commercial SDK A (version: 6.16, Scandit, commercial)
- Commercial SDK B (version: 13.9, Aspose, commercial)
- BoofCV (version: 0.43.1, open-source)
- ZXing (version: 3.5.1, open-source)
- ZBar (version: pyzbar 0.1.9, open-source)
- WeChat QR code detector in OpenCV (version: OpenCV 4.7.0.72, open-source)
Where an SDK supports multiple barcode formats, its runtime settings were restricted to QR codes only to ensure a fair single-format comparison.
Understand the Evaluation Metrics
Performance is measured on two dimensions: reading rate (accuracy) and runtime (speed).
The reading rate is the proportion of QR codes in the dataset that were successfully detected:
Reading rate = Detected QR codes / Total QR codes
A QR code is counted as detected if the bounding polygon returned by the library overlaps with the ground-truth bounding polygon by more than 20%:
Here is the simplified code for doing this:
function isDetected(barcodeResult){
  for (let j = 0; j < groundTruthList.length; j++) {
    const groundTruth = groundTruthList[j];
    let percent;
    const points1 = getPointsFromBarcodeResultResult(barcodeResult);
    const points2 = getPointsFromGroundTruth(groundTruth);
    percent = overlappingPercent(points1,points2);
    if (percent > 0.20) {
      return true;
    }
  }
  return false;
}
The overlapping percent is calculated with the following code:
export function overlappingPercent(pts1:Point[] ,pts2:Point[]) : number {
  const rect1 = getRectFromPoints(pts1);
  const rect2 = getRectFromPoints(pts2);

  let leftRect;
  let rightRect;
  if (rect1.left<rect2.left) {
    leftRect = rect1;
    rightRect = rect2;
  }else{
    leftRect = rect2;
    rightRect = rect1;
  }
  let upperRect;
  let lowerRect;
  if (rect1.top<rect2.top) {
    upperRect = rect1;
    lowerRect = rect2;
  }else{
    upperRect = rect2;
    lowerRect = rect1;
  }
  if (leftRect.right > rightRect.left && upperRect.bottom>lowerRect.top) {
    const overlappedX = Math.min(leftRect.right,rightRect.right) - rightRect.left;
    const overlappedY = Math.min(upperRect.bottom,lowerRect.bottom) - lowerRect.top;
    const overlappedArea = overlappedX * overlappedY;
    const area1 = rect1.width * rect1.height;
    const area2 = rect2.width * rect2.height;
    const smallerArea = Math.min(area1,area2);
    return overlappedArea/smallerArea;
  }else{
    return 0;
  }
}
The decoded text is not used as a detection criterion — all libraries achieved 100% text precision on the codes they successfully detected.
Note on ZXing: ZXing only returns the three finder-pattern corner points of a QR code rather than a full polygon. A postprocessing step converts these three points into an equivalent bounding polygon before the overlap calculation.
Runtime is measured in the Python backend as the wall-clock time of the decode call only, excluding file I/O:
start_time = time.time()
results = self.reader.decode_bytes(file_bytes)
end_time = time.time()
elapsedTime = int((end_time - start_time) * 1000)
Detection Results Across 16 Categories
The table below shows the reading rate (%) for each library across all 16 image categories. The best result per category is bolded.
| Category | Dynamsoft | BoofCV | ZXing | ZBar | OpenCV WeChat | Commercial SDK A | Commercial SDK B |
|---|---|---|---|---|---|---|---|
| blurred | 66.15 | 38.46 | 21.54 | 35.38 | 46.15 | 33.85 | 36.92 |
| brightness | 81.18 | 78.82 | 52.94 | 50.59 | 23.53 | 52.94 | 51.76 |
| bright_spots | 43.3 | 27.84 | 20.62 | 19.59 | 24.74 | 8.25 | 29.9 |
| close | 95 | 100 | 5 | 12.5 | 67.5 | 22.5 | 25 |
| curved | 70 | 56.67 | 31.67 | 35 | 43.33 | 31.67 | 36.67 |
| damaged * | 51.16 | 16.28 | 20.93 | 25.58 | 30.23 | 27.91 | 27.91 |
| glare | 84.91 | 32.08 | 20.75 | 35.85 | 58.49 | 43.4 | 20.75 |
| high_version * | 97.3 | 40.54 | 5.41 | 27.03 | 18.92 | 78.38 | 35.14 |
| lots * | 100 | 99.76 | 82.86 | 18.1 | 0 | 14.52 | 97.14 |
| monitor | 100 | 82.35 | 0 | 0 | 94.12 | 11.76 | 5.88 |
| nominal | 93.59 | 89.74 | 53.85 | 66.67 | 71.79 | 64.1 | 65.38 |
| noncompliant * | 92.31 | 3.85 | 15.38 | 50 | 76.92 | 61.54 | 11.54 |
| pathological * | 95.65 | 43.48 | 34.78 | 65.22 | 91.3 | 0 | 78.26 |
| perspective | 62.86 | 80 | 37.14 | 42.86 | 42.86 | 65.71 | 34.29 |
| rotations | 99.25 | 96.24 | 42.11 | 48.87 | 32.33 | 99.25 | 69.17 |
| shadows | 100 | 85 | 65 | 90 | 60 | 90 | 95 |
| total average | 83.29 | 60.69 | 31.87 | 38.95 | 48.89 | 44.11 | 45.04 |


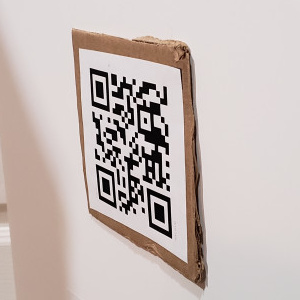


- Damaged QR codes are the ones with scratches, dents, etc.
- Pathological QR codes have the markers intentionally corrupted. The markers are designed for the detection of QR Codes.
- The lots category has multiple QR Codes in one image.
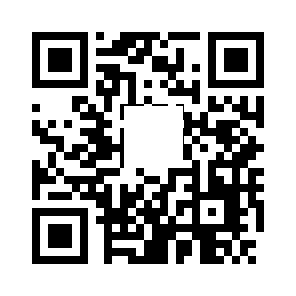
- The QR Code symbology ranges from Version 1 to Version 40. The Version Information represents the number of cells (per side) making up the code. More on the QR Code versions.
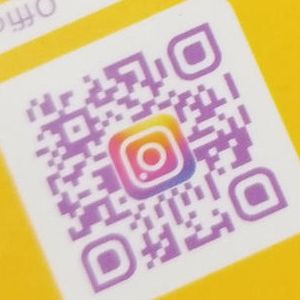
- Non-compliant QR Codes have customized designs, for example, colors, or a logo at the center.
Dynamsoft Barcode Reader Leads Overall
Dynamsoft Barcode Reader ranks 1st in 14 of 16 categories and achieves a total average reading rate of 83.29% — more than 20 percentage points ahead of the next closest commercial option. In the most challenging categories (blurred, curved, glare, and high-version), it is the only solution to exceed 67%.

It ranks 2nd in the close category (behind BoofCV’s perfect 100%) and 3rd in perspective.
Some categories have inherently low reading rates across all libraries because the source images contain QR codes that are physically unreadable even by human inspection.
Choose the Right Open-Source Library: ZXing vs ZBar vs BoofCV vs OpenCV WeChat
If an open-source solution is required, BoofCV and OpenCV WeChat are the stronger choices. Both are grounded in modern computer vision techniques and are actively maintained, which likely accounts for their advantage over ZXing and ZBar in challenging conditions.
- OpenCV WeChat achieves the highest reading rate for damaged and pathological QR codes among all libraries. Its strong performance on non-compliant QR codes (those with custom colors or center logos) reflects the prevalence of such codes in its WeChat-sourced training data.
- BoofCV is the best open-source option for benchmark categories that exclude noncompliant and pathological codes, and it achieves a perfect 100% on the close category. It is particularly strong in the “lots” category (multiple QR codes per image).
- ZXing and ZBar trail significantly in most real-world conditions and are not recommended for applications where image quality cannot be guaranteed.
Runtime Performance: Decode Speed per Image
Average decode time per image in milliseconds (lower is better):
| Engine | Result |
|---|---|
| Dynamsoft | 195.01 |
| Commercial SDK A | 1400.43 |
| Commercial SDK B | 346.27 |
| ZXing | 179.57 |
| ZBar | 157.31 |
| BoofCV | 104.95 |
| OpenCV Wechat | 757.71 |

Common Issues & Edge Cases
- High-version QR codes (Version 20+) fail silently in ZXing and ZBar. Both libraries return no result without an error, making them unreliable for dense-data QR codes used in logistics or document tracking. Use Dynamsoft or BoofCV for high-version requirements.
- Non-compliant QR codes with center logos cause false negatives in BoofCV. BoofCV scores only 3.85% on the noncompliant category. If your deployment scans branded QR codes (e.g., marketing materials, loyalty cards), prefer OpenCV WeChat or Dynamsoft.
- Multi-code images return incomplete results in ZBar and Commercial SDK A. ZBar detects only 18.10% of codes in the lots category. If scanning images with many QR codes simultaneously, only Dynamsoft (100%) and BoofCV (99.76%) are reliable.
Conclusion
Across 1,232 QR codes spanning 16 real-world difficulty categories, Dynamsoft Barcode Reader achieves the highest overall reading rate (83.29%) while maintaining competitive decode speed (195 ms/image). It is the most robust choice for production applications that must handle challenging QR code conditions.
For teams with an open-source requirement, BoofCV and OpenCV WeChat are the best available options, each excelling in different categories. ZXing and ZBar are viable only for controlled-environment use cases where image quality is consistently high.
The full detailed benchmark results are published at dynamsoft.com/barcode-dataset/benchmark/project/QRCode.
Frequently Asked Questions
Which QR code reading library has the best accuracy?
In this benchmark, Dynamsoft Barcode Reader achieved the highest total average reading rate of 83.29% across 16 image categories, outperforming ZXing (31.87%), ZBar (38.95%), BoofCV (60.69%), and OpenCV WeChat (48.89%).
Which open-source QR code library is most accurate?
BoofCV (60.69% overall) and OpenCV WeChat (48.89%) significantly outperform ZXing (31.87%) and ZBar (38.95%) on this dataset. The best choice between BoofCV and OpenCV WeChat depends on your category of images: OpenCV WeChat is better for damaged/pathological/non-compliant codes, BoofCV is better for multi-code and close-up scenarios.
Is ZXing still a good QR code scanner?
For images captured in controlled, well-lit conditions with undamaged QR codes, ZXing is functional. However, this benchmark shows it ranks last among the open-source libraries in total average reading rate (31.87%), making it a poor choice for real-world deployments.
How was the dataset selected?
The dataset was originally assembled by Peter Abeles (BoofCV) and consists of 536 images containing 1,232 QR codes, covering 16 categories of real-world imaging challenges. Ground-truth bounding polygons are provided for each QR code.
What is the best Python QR code reader for performance?
Among the Python-compatible options tested, Dynamsoft Barcode Reader (83.29%) provides the highest reading rate with a 195 ms/image decode time. For open-source Python QR code reading, ZBar via pyzbar (38.95%) and OpenCV WeChat (48.89%) are the most commonly used, though BoofCV (60.69%) outperforms both in overall accuracy.