


Usage Statistics
Usage statistics are available at two levels: License Item and Project.
- The License Item stats page shows usage and configuration details for a single license item, including which project it belongs to.
- The Project stats page aggregates usage across all license items configured to that project.
How to Get Here
License Item stats page: Log into the Customer Portal → Order → Full License → locate the license item → Manage → Usage Statistics
Project stats page: From any License Item stats page, click the linked project name to navigate to the project-level view.
License Item Stats Page
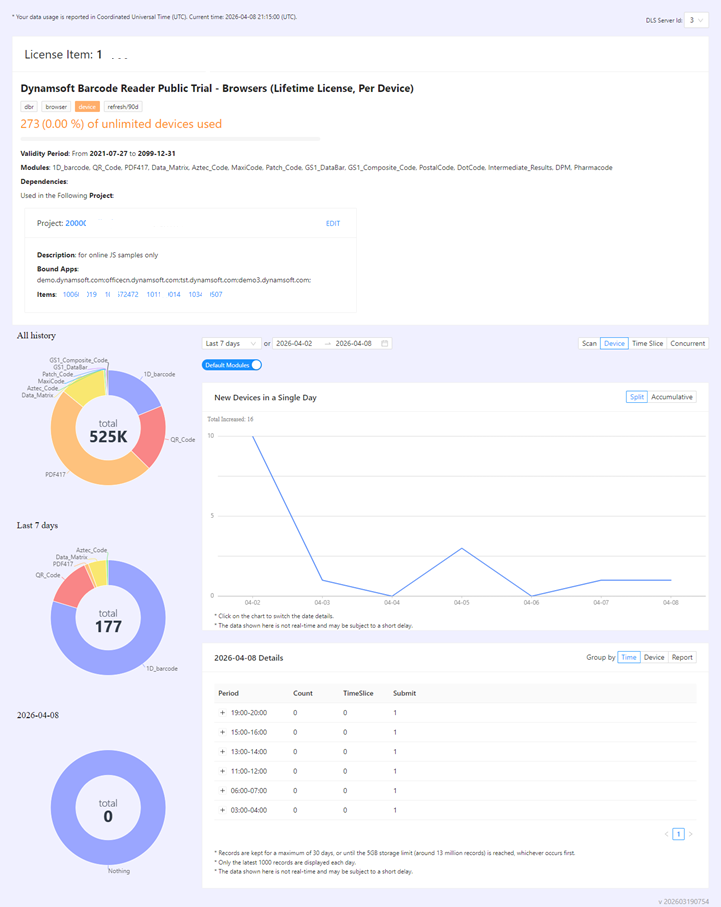
The License Item stats page includes (but is not limited to):
- License Item ID and name — displayed at the top
- Tags — key attributes of the license item, such as product, version, deployment type
(computer or device), and refresh interval (e.g.
refresh/1d) - Usage — number and percentage of the allocated quota used; the quota type (devices or scans) depends on the license item type
- Validity period — the active date range for this license item
- Modules — the specific feature modules covered by this license
- Project association — the project this license item is configured to; click the project name to go to the Project stats page
- Pie charts — three charts showing usage for “All History”, “The selected period”, and “Today”
- Line chart — usage trend over the selected time period
Notes
- Depending on the type of the license item, some charts or data columns may not appear.
Project Stats Page
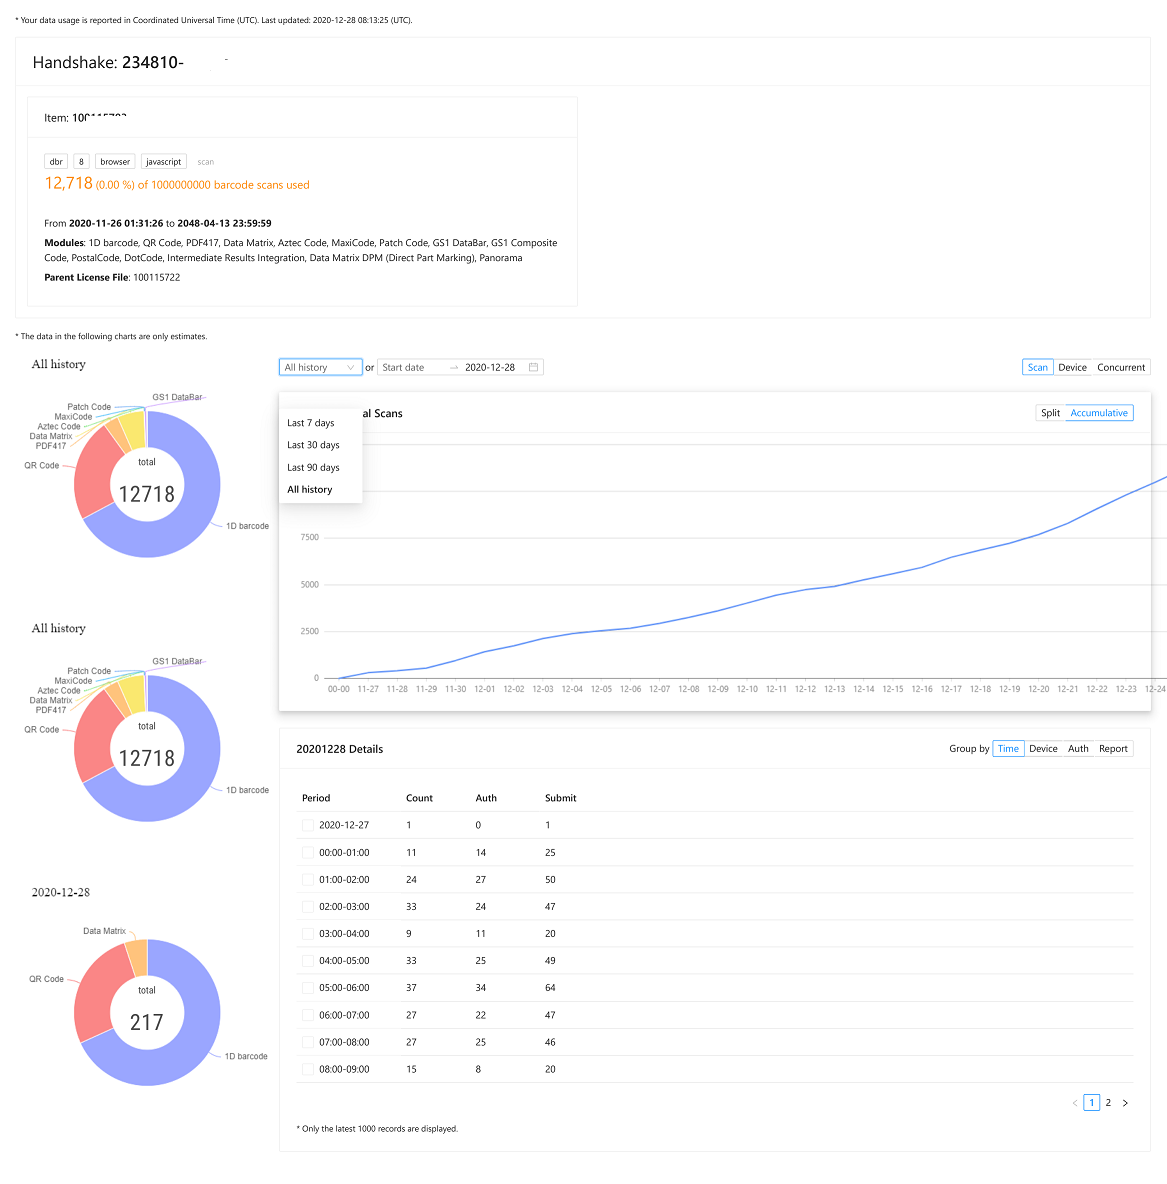
The Project stats page includes (but is not limited to):
- Project name and associated license items — listed at the top; click any license item to go to its License Item stats page
- Pie charts — three charts showing usage for “All History”, “The selected period”, and “Today”
- Line chart — usage trend over the selected time period
- Usage table — detailed usage broken down in 2-hour intervals
Notes
- Depending on the license items configured to the project, some charts or data columns may not appear.
- Usage from all license items configured to the project is counted together.
- A license item may be configured to multiple projects; only usage associated with the current project is shown on that project’s stats page.